Joining by Nearby Dates
 just a few days off…
I’ve been wrestling with ideas for how to standardize sampling dates for a while now. The data sets I’m working with have fairly regular sampling intervals, but sometimes they aren’t sampled on the same day - and this drives me crazy. In terms of real-world sampling plans it makes total sense - weekends, rainy days, multi-day sampling events - but in terms of cleaning and working with the data it’s a pain. Here I’ve made up some fake data that shows the problem I’m having, then use fuzzyjoin to make it work. In the process I realized I could probably do approximately the same thing using dplyr. It’s a snowy day in Colorado, so let’s get to it.
library(tidyverse)
library(lubridate)
well <- t(data.frame(1,1,1,1,2,2,2,2,3,3,3,3,4,4,4,4)) #making some fake wells
date <- seq.Date(ymd("1996-01-01"), ymd("1996-12-01"), by = "quarter") #making some fake dates
date <- rep(date, times = 4)
date <- date + sample(-7:7,16,replace=T)
concentration <- sample(1:20,16,replace=T) #making some fake concentrations
df_a <- cbind.data.frame(well, date, concentration) #first fake dataframe
df_a <- remove_rownames(df_a)

date <- date + sample(-7:7,16,replace=T)
concentration <- sample(1:20,16,replace=T)
df_b <- cbind.data.frame(well, date, concentration) #second fake dataframe
df_b <- remove_rownames(df_b)

df_a #one set of samples
## well date concentration
## 1 1 1996-01-07 13
## 2 1 1996-03-27 7
## 3 1 1996-07-02 20
## 4 1 1996-09-28 17
## 5 2 1995-12-29 5
## 6 2 1996-03-30 12
## 7 2 1996-06-28 19
## 8 2 1996-10-05 14
## 9 3 1995-12-30 19
## 10 3 1996-04-05 13
## 11 3 1996-07-04 8
## 12 3 1996-10-03 9
## 13 4 1996-01-03 11
## 14 4 1996-04-07 11
## 15 4 1996-06-30 4
## 16 4 1996-09-29 5df_b #another set of samples## well date concentration
## 1 1 1996-01-06 7
## 2 1 1996-04-03 7
## 3 1 1996-06-30 4
## 4 1 1996-09-29 15
## 5 2 1995-12-30 1
## 6 2 1996-03-31 20
## 7 2 1996-07-02 16
## 8 2 1996-09-29 15
## 9 3 1995-12-24 10
## 10 3 1996-04-10 12
## 11 3 1996-07-03 12
## 12 3 1996-10-08 7
## 13 4 1996-01-08 11
## 14 4 1996-04-10 9
## 15 4 1996-06-30 10
## 16 4 1996-10-01 11df_ab <- rbind(df_a, df_b)
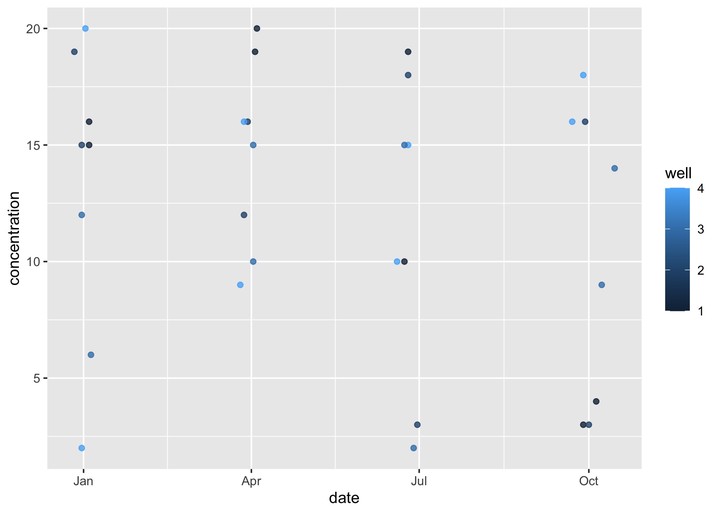
ggplot(df_ab, aes(x=date, y=concentration, color=well)) + geom_point(alpha=0.8) Do you see the problem?!?! I can’t make the neat dataframe with both observations that I want. If I join on exact dates I loose a bunch of data. After some googling I found a package called {fuzzyjoin} that allows you to join columns within a certain tolerance, so they don’t have to exactly match up. Great - that’s what I want. Unfortunately, in this case I want to join by two columns,
 well and date, but the max_dist argument will apply to both, so since I just made the wells 1-4, if I wanted to capture dates within more than four days of each other all wells would be considered matches. So I fuzzy joined first by date, then filtered for the observations where well.x matches well.y. After some cleaning up, it looks pretty good.
library(fuzzyjoin)
df_c <- difference_inner_join(df_a, df_b, by = "date", max_dist= 14) #join dates within two weeks
df_c <- df_c %>%
  filter(well.x == well.y) %>% #keep only joined observations from the same well
  rename("PCE"=concentration.x, "TCE"=concentration.y, "well"=well.x) %>% #change some names
  mutate(date = round_date(date.x, unit = "month")) %>% #round to nearest month
  select(-c("well.y", "date.x", "date.y")) #remove duplicate well name

head(df_c)
## well PCE TCE date
## 1 1 13 7 1996-01-01
## 2 1 7 7 1996-04-01
## 3 1 20 4 1996-07-01
## 4 1 17 15 1996-10-01
## 5 2 5 1 1996-01-01
## 6 2 12 20 1996-04-01df_c %>% pivot_longer(cols = c(PCE, TCE)) %>%
ggplot(aes(x=date, y=value, color=well)) + geom_point(alpha=0.5) When I did the
 round_date thing above I thought, well, couldn’t I just have rounded by date first, then joined by exact date after? So I did just that and got the same results. This wouldn’t always give the same results, for example if a well was sampled around the middle of the month and one observation was rounded up while another was rounded down. The {fuzzyjoin} method joins relative to the distance between the dates, not based on the rounded date. In most cases it won’t matter, but there’s a small distinction.
df_a <- mutate(df_a, date = round_date(date, unit = "month"))
df_b <- mutate(df_b, date = round_date(date, unit = "month"))
#df_c <- inner_join(df_a, df_b, by = date)
# ^this causes an error: Error: `by` must be a (named) character vector, list, or NULL, not a `Date` object.
df_a$date <- as.double(df_a$date)
df_b$date <- as.double(df_b$date)
df_c <- inner_join(df_a, df_b, by = "date")
df_c <- df_c %>%
filter(well.x==well.y) %>%
rename("PCE"=concentration.x, "TCE"=concentration.y, "well"=well.x) %>%
select(-c("well.y")) #remove duplicate well name
df_c <- df_c %>%
mutate(date = as.Date(date, origin = "1970-01-01"))
head(df_c)## well date PCE TCE
## 1 1 1996-01-01 13 7
## 2 1 1996-04-01 7 7
## 3 1 1996-07-01 20 4
## 4 1 1996-10-01 17 15
## 5 2 1996-01-01 5 1
## 6 2 1996-04-01 12 20df_c %>% pivot_longer(cols = c(PCE, TCE)) %>%
ggplot(aes(x=date, y=value, color=well)) + geom_point(alpha=0.5) Now it’s time to apply this to a real dataset and see what problems I’ll run into…because they’re out there…lurking…spooky!